
BTTS explained: both teams to score, odds and stats
Both teams to score wins when each side scores at least once. How often it happens in 38,603 matches, what decides it and how to read the odds.
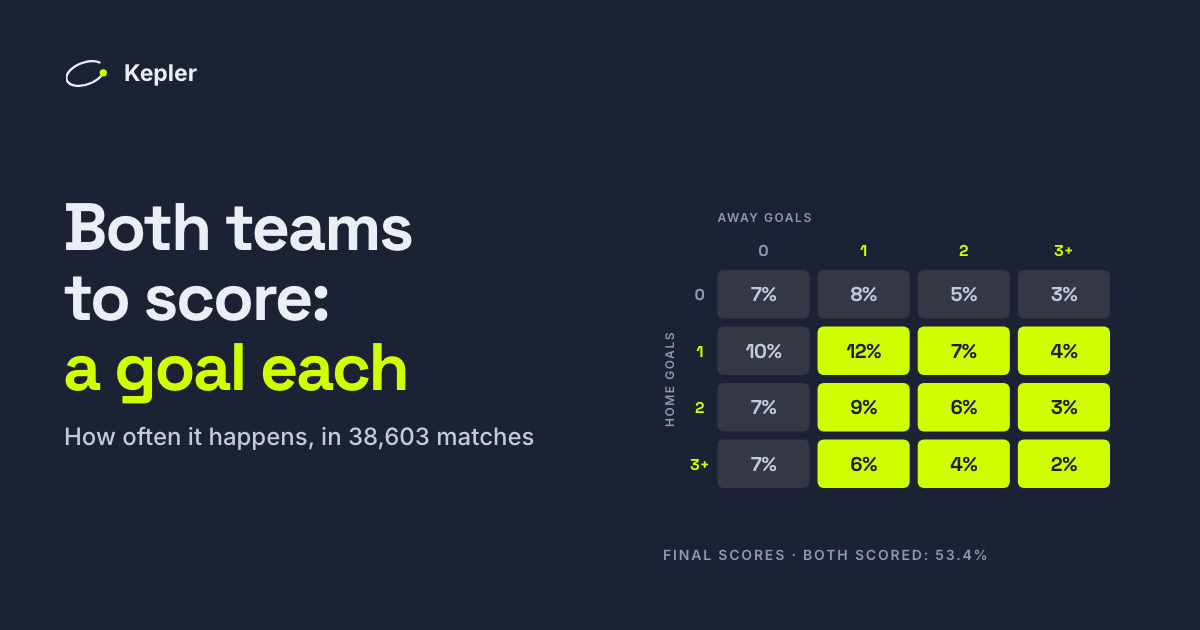
Both teams to score, BTTS for short, is a bet on one simple thing: each side scores at least once. The result does not matter, and neither does the number of goals. A 1-1 wins it, a 4-0 loses it. What makes it interesting is what decides it: not how many goals a match is expected to have, but whether the weaker attack will find one.
We took 38,603 finished matches from the 22 leagues we cover, from July 2021 to October 2026, and counted.
In short
- BTTS Yes wins when both teams score at least once. BTTS No wins when at least one of them does not.
- In our 38,603 matches, both teams scored in 53.4%. Slightly more often than not.
- No is rarely 0-0. Goalless draws were only 15.1% of the matches where both teams did not score; most were one side winning without conceding, like 1-0 or 2-0.
- The weaker attack decides it. Matches with the same expected goals but one side much stronger saw both teams score 48.3% of the time; evenly matched ones 56.2%.
- Even a good model rarely gives more than 60%, so the price you take matters as much as the pick.
What both teams to score means
The bet has two sides. Yes needs a goal from each team; No needs at least one team to stay at zero. Who wins and by how much is irrelevant:
| Final score | BTTS Yes | BTTS No |
|---|---|---|
| 0-0 | Lost | Won |
| 1-0 | Lost | Won |
| 4-0 | Lost | Won |
| 1-1 | Won | Lost |
| 2-1 | Won | Lost |
| 3-2 | Won | Lost |
A few details decide the close calls:
- Regular time only. The 90 minutes plus stoppage time count. Extra time and penalty shoot-outs do not, unless the market says it includes them.
- Own goals count, for the other team. An own goal by the home side's defender is a goal for the away side, so it can win a BTTS Yes.
- Disallowed goals do not. A goal ruled out by VAR never counts.
- Variants are different bets. Both teams to score in the first half, in both halves, or together with a result or over 2.5 are separate markets with their own odds.
How often both teams score
In our matches the home side scored at least once in 77.3%, the away side in 69.0%, and both in 53.4%:
The most common scores on each side of the bet:
| BTTS Yes | Share of matches | BTTS No | Share of matches |
|---|---|---|---|
| 1-1 | 12.3% | 1-0 | 10.3% |
| 2-1 | 9.1% | 0-1 | 7.6% |
| 1-2 | 7.2% | 2-0 | 7.1% |
| 2-2 | 5.5% | 0-0 | 7.1% |
| 3-1 | 4.1% | 0-2 | 4.7% |
1-1 alone is almost a quarter of every BTTS Yes. And because a draw with goals is always a yes, 72.9% of draws had both teams scoring, against 46.4% of matches with a winner.
One more finding makes the bet easier to think about. Whether one team scores told us nothing about whether the other would: the away side scored in 69.1% of the matches where the home side scored, and in 69.0% of those where it did not. The two halves of the bet behave like two separate coins, which is why multiplying the two chances, as below, works.
The rate is steady over time. Every full season since 2021 landed between 51.3% and 54.2%. The seasons under way are running higher, at 56.9% after 2,680 matches, along with goals in general; it is too early to tell whether that lasts.
Which leagues see both teams score most
The league matters, but less than it does for goals. In our data the share ranges from 61.7% in Norway's 1. Division to 45.0% in Brazil's Serie B:
| League | BTTS | Home side scored | Away side scored |
|---|---|---|---|
| 1. Division (Norway) | 61.7% | 81.8% | 75.5% |
| Bundesliga (Germany) | 60.1% | 81.1% | 74.0% |
| Superliga (Denmark) | 59.1% | 79.4% | 74.3% |
| Liga Portugal (Portugal) | 49.7% | 75.3% | 68.1% |
| La Liga 2 (Spain) | 50.0% | 75.6% | 64.0% |
| Serie B (Brazil) | 45.0% | 75.3% | 59.3% |
Look at the last two columns. Home sides score in about three matches out of four almost everywhere, from 75.0% to 81.8% across our 22 leagues. The difference between leagues is mostly the away side: 75.5% of away teams scored in Norway's 1. Division, 59.3% in Brazil's Serie B.
League rates are also less stable for BTTS than for goals. A league's rate in one season and the next had a correlation of 0.57, against 0.78 for over 2.5. All 22 leagues, with last season and this one, are in the best leagues for over 2.5 goals and BTTS.
What the odds are telling you
Every price hides a chance. Divide 1 by the odds:
| Odds for BTTS Yes | Chance it implies |
|---|---|
| 1.60 | 62.5% |
| 1.70 | 58.8% |
| 1.80 | 55.6% |
| 1.90 | 52.6% |
| 2.00 | 50.0% |
| 2.20 | 45.5% |
Those chances include the bookmaker's margin. Put Yes and No together and they add up to more than 100%: Yes at 1.80 and No at 2.00 imply 55.6% + 50.0% = 105.6%. Take the extra 5.6% out and the market's real view of Yes is about 52.6%. How to do that properly is in de-vigging: recovering the true probability.
How to predict both teams to score
Each side's chance of scoring
Start with how many goals each team is expected to score against this opponent, ideally from the chances they create and concede rather than past goals (see our guide to xG in betting). Goals arrive roughly at random, so the Poisson distribution turns a team's expected goals into its chance of scoring at least once:
| A team's expected goals | Chance it scores |
|---|---|
| 0.50 | 39.3% |
| 0.75 | 52.8% |
| 1.00 | 63.2% |
| 1.25 | 71.3% |
| 1.50 | 77.7% |
| 2.00 | 86.5% |
Multiply the two teams' chances and you have the chance both score. Two sides expected to score 1.50 and 1.00 goals: 77.7% × 63.2% = 49.1%.
The weaker attack decides it
This is where BTTS parts ways with over 2.5. For over 2.5 only the total matters. For BTTS the split matters, because the bet is only as strong as the team least likely to score:
| Expected goals, home and away | Total | Both score | Fair odds |
|---|---|---|---|
| 1.50 and 1.50 | 3.00 | 60.4% | 1.66 |
| 1.80 and 1.20 | 3.00 | 58.3% | 1.71 |
| 2.10 and 0.90 | 3.00 | 52.1% | 1.92 |
| 2.40 and 0.60 | 3.00 | 41.0% | 2.44 |
The same three expected goals, and the chance of both teams scoring falls from 60% to 41% as the match gets more one-sided.
What real matches say
We checked this against what happened. Before each of 36,997 matches a Dixon-Coles model (the classic goals model) estimated each side's goals. First, matches with the same expected total, between 2.5 and 3.0 goals, by how much of it the weaker side was expected to score:
| Weaker side's share of the goals | Matches | Both scored | Over 2.5 |
|---|---|---|---|
| under 30% (one-sided) | 1,737 | 48.3% | 55.0% |
| 30% to 38% | 3,194 | 53.9% | 52.3% |
| 38% to 45% | 4,361 | 54.9% | 50.4% |
| 45% to 50% (even) | 3,558 | 56.2% | 51.4% |
The split mattered, and in opposite directions for the two bets: the one-sided matches had the fewest both-teams-to-score results and the most overs, thanks to scores like 3-0. A match that looks like a goal fest on paper can be a poor BTTS bet.
But the effect was smaller than the formula promised. Grouping the same matches by the weaker side's expected goals:
| Weaker side's expected goals | Matches | Formula said | Both scored |
|---|---|---|---|
| up to 0.8 | 7,532 | 37.4% | 48.6% |
| 0.8 to 1.0 | 10,002 | 46.0% | 51.8% |
| 1.0 to 1.2 | 10,100 | 51.9% | 53.6% |
| 1.2 to 1.4 | 6,093 | 57.9% | 57.2% |
| over 1.4 | 3,270 | 65.9% | 60.8% |
Where the formula gave 37%, both teams still scored 48.6% of the time; where it gave 66%, only 60.8%. The real rate stayed between about 49% and 61% across every group. Forecasts of a team's goals are estimates, and the extreme ones are the most likely to be wrong, so the truth sits closer to the middle than the formula. Weak teams score more often than their numbers suggest. A model that does not correct for this will see value on BTTS No where there is none.
What a calibrated model looks like
Our own model combines several of these inputs and is checked against results. Tested match by match on 32,117 matches since July 2022, each one predicted only from what was known before it:
| Model's chance | Share of matches | Both scored |
|---|---|---|
| under 45% | 4.5% | 45.3% |
| 45% to 50% | 19.9% | 48.1% |
| 50% to 55% | 40.3% | 52.8% |
| 55% to 60% | 26.2% | 56.7% |
| 60% or more | 9.1% | 61.9% |
The chances match the results closely: when the model says 57%, about 57% of those matches see both teams score. But look how narrow the range is. For six matches in ten the model's chance sits between 45% and 55%, and only 9.1% get 60% or more. When it favoured one side it was right 54.6% of the time, against about 56% for over 2.5. Whether both teams score is harder to call than how many goals there will be, which is one more reason the price matters so much.
What doesn't move it much
Two popular factors did little in our tests. The referee barely affects goals: see how referees affect football. And weather moves the total by a fraction of a goal at most: see weather in football betting. Team news does matter, but the market moves for it quickly: in our tests, confirmed line-ups and absences added nothing to our forecasts that the closing price did not already include.
When both teams to score is worth a bet
Since even a good model rarely goes far from 50%, the price decides everything. The test is one line:
Value = chance × odds − 1
Say the chance of both teams scoring is 57%. The fair odds are 1 ÷ 0.57 = 1.75.
- At 1.85: 0.57 × 1.85 − 1 = +5.5%. Worth taking.
- At 1.70: 0.57 × 1.70 − 1 = −3.1%. The same pick, at a price that loses over time.
More on this in what is a value bet. Expect runs of losses even with a real edge, and stake the same small amount every time, as in our bankroll guide.
Both teams to score and over 2.5
The two bets usually go together. In our matches:
- 41.0% had both: both teams scored and 3 or more goals.
- When both teams scored, the match went over 2.5 76.9% of the time. The only way to get a yes and stay under is 1-1, 12.3% of all matches.
- When the match went over 2.5, both teams had scored 80.6% of the time. The rest were one side scoring all the goals, like 3-0.
- When it stayed under 2.5, both teams scored only 25.1% of the time.
So "BTTS and over 2.5" is not two chances multiplied together: they usually win or lose as one. The full picture of the over 2.5 side is in over 2.5 goals explained.
How Kepler prices both teams to score
Our model gives every match a chance of both teams scoring, and a pick is published only when that chance clears its threshold, with the fair odds beside it, so you can see whether the price on offer is worth taking. Both teams to score is also where our picks have beaten the market most often: in September 2026, 65.9% of those with a closing price were taken at a better price than the sharp close. Every published pick goes on the public track record, wins and losses alike, and every match page shows the market's price for the match with the margin removed.
Frequently asked questions
What does both teams to score mean?
It is a bet that each team will score at least one goal. BTTS Yes wins with any score where both sides scored, like 1-1 or 3-2; BTTS No wins if at least one team fails to score, like 0-0, 1-0 or 4-0. The result and the number of goals do not matter.
Does an own goal count for both teams to score?
Yes. An own goal counts as a goal for the other team, so an own goal by a home defender counts as the away side scoring. Only the 90 minutes plus stoppage time count, unless the market says otherwise, and goals ruled out by VAR do not count.
How often do both teams score in football?
Slightly more than half the time. In 38,603 matches from 22 leagues, July 2021 to October 2026, both teams scored in 53.4%. The home side scored in 77.3% of matches and the away side in 69.0%; 1-1 was the most common score with both teams scoring.
Which league has the most both teams to score?
In our data, Norway's 1. Division: both teams scored in 61.7% of matches, ahead of the Bundesliga (60.1%) and Denmark's Superliga (59.1%). The fewest were in Brazil's Serie B (45.0%), Liga Portugal (49.7%) and La Liga 2 (50.0%).
What are good odds for both teams to score?
It depends on the real chance. The fair odds are 1 divided by the chance: 1.75 for a 57% chance, 2.00 for 50%. A price above the fair odds has value; a price below it loses money over time, however likely the goals look.
Betting involves risk. Both teams to score is close to a coin flip in most leagues, and no record guarantees what happens in the next match. Only stake what you can afford to lose. 18+.