
How referees affect football: cards, not goals
We checked 42,172 matches: referees change cards and fouls, not goals. What a referee's record tells you and how to use it when betting on cards.
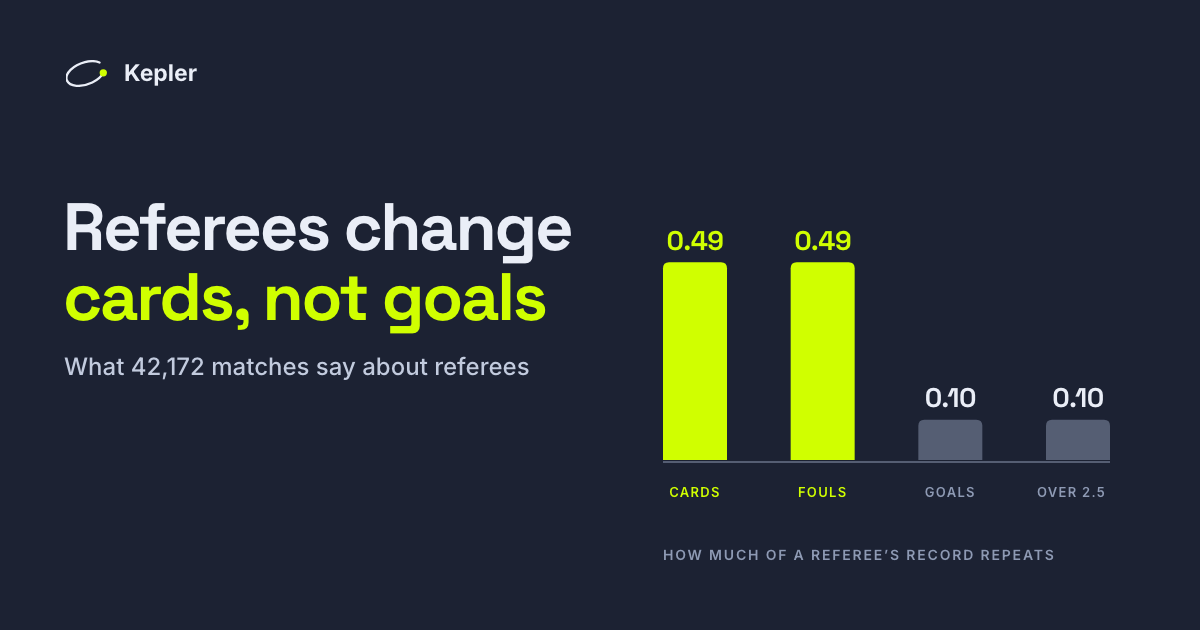
Before a match, plenty of bettors look up the referee. A strict one means cards, a lenient one means a flowing game, and some will tell you that a particular referee always produces goals. Most of that is easy to say and hard to check.
So we checked it. We took 42,172 finished matches from the 23 leagues we cover, from April 2021 to October 2026, each with the referee who took charge, and asked a simple question: when a referee looks different from their colleagues, is that the referee, or is it luck? The answer splits cleanly in two.
The short version
- Referees really do change cards and fouls. The strictest fifth of referees, picked on their earlier matches, were still showing about 0.3 more cards a match than average in their later ones. The most lenient fifth stayed about 0.5 below.
- They barely change goals. Referees whose earlier matches went over 2.5 goals 10 points more often than usual were back to normal in their later ones. The same happened the other way round.
- Both teams to score and home wins don't depend on the referee. The small differences that showed up did not repeat.
- The league matters more than the referee. Cards per match run from 3.2 in Norway's 1. Division to 5.7 in Portugal's Liga Portugal. Within one league, the lasting gap between a strict and a lenient referee is about 0.8.
- A referee's record is about half signal and half luck. Before using one, pull it halfway back towards the league average.
What a referee can and cannot change
A referee decides what counts as a foul, who gets booked, who gets sent off and when to give a penalty. Those calls vary from one person to the next, so it makes sense that cards and fouls vary too.
Goals are different. Most goals come from what the two teams do with the ball, and a referee touches that only at the edges: a penalty given or not, an advantage played, a goal ruled out. Penalties average 0.27 a match in our data, so even a referee who gives noticeably more of them adds only a handful of goals over a season.
Red cards are the exception that proves the rule. A sending-off can change a match completely, but there are only 0.25 of them a match, so they rarely decide a total over a season.
How we measured it
The data comes from our provider, SportMonks: 42,172 finished matches with a named referee in charge, across 23 leagues in 12 countries, with each match's goals, cards, fouls and penalties. That is 851 referees in all.
Two choices keep the comparison fair.
Every referee is compared with the matches around them. Some leagues book far more players than others, and a referee who works in Spain shows more cards than one in Norway without being any stricter. So each match is measured against the average for its own league and season.
We check whether a difference repeats. A referee can look strict over 30 matches by luck alone. For the 428 referees with at least 40 matches, we split each one's games in two, earlier and later, and checked whether the earlier half predicts the later half. A real difference carries over. A lucky one does not.
| Per match | Average | Real gap | Repeats? |
|---|---|---|---|
| Cards, yellow and red | 4.43 | ±0.41 | Yes, 0.49 |
| Fouls | 24.1 | ±1.3 | Yes, 0.49 |
| Red cards | 0.25 | ±0.04 | Weakly, 0.17 |
| Penalties | 0.27 | ±0.01 | No, 0.04 |
| Goals | 2.70 | ±0.08 | Barely, 0.10 |
| Over 2.5 goals | 50.9% | ±2.3 pts | Barely, 0.10 |
| Both teams to score | 53.4% | ±1.6 pts | No, 0.02 |
| Home win | 43.7% | ±0.9 pts | No, 0.06 |
The real gap is how far a typical referee sits from the average once chance is taken out. The last column is a correlation: 0 means a referee's earlier matches tell you nothing about their later ones, and 1 would mean they tell you everything.
What the table shows:
- Cards and fouls repeat. About half of a referee's difference in one set of matches shows up again in the next. That is a real, lasting effect.
- Red cards repeat a little. Sendings-off are rare, so most of what a referee's record of them shows is noise.
- Penalties don't repeat. They are also counted on fewer matches. In many leagues and seasons, the Premier League's among them, the provider records a penalty count mostly when one was given, which inflates the average, so these figures use only the 17,317 matches from seasons where every match has one.
- Goals, over 2.5 and both teams to score don't repeat. The differences between referees are almost entirely chance.
- No referee showed a lasting home bias. Home win rates barely differed, and what difference there was did not carry over.
Strict referees stay strict. Goals referees don't
The clearest way to see the split: sort referees into five groups by their earlier matches, then look at their later ones.
| Referees | Cards, earlier → later | Over 2.5, earlier → later |
|---|---|---|
| Lowest fifth | −0.71 → −0.46 | −12.0 → −0.8 pts |
| Middle fifth | +0.05 → 0.00 | +0.5 → +0.3 pts |
| Highest fifth | +0.80 → +0.31 | +10.5 → +0.5 pts |
All figures are against each league and season's average. For cards, the lowest fifth are the most lenient referees and the highest fifth the strictest. For over 2.5, they are the referees whose matches went over least and most often.
The cards gap shrinks, from 1.5 cards between the two groups to 0.8, but it stays. The over 2.5 gap of more than 22 points all but vanishes. A referee who looked like a goals referee over their first few dozen matches was an ordinary referee over the next few dozen.
The league matters more than the referee
| League | Matches | Cards per match | Fouls per match |
|---|---|---|---|
| Liga Portugal (Portugal) | 1,600 | 5.70 | 27.9 |
| Serie B (Italy) | 2,011 | 5.29 | 29.2 |
| Serie A (Brazil) | 1,824 | 5.28 | 26.5 |
| La Liga (Spain) | 1,987 | 5.08 | 25.7 |
| Serie A (Italy) | 1,969 | 4.49 | 25.1 |
| Premier League (England) | 1,968 | 4.26 | 21.5 |
| Bundesliga (Germany) | 1,583 | 4.13 | 22.4 |
| Ligue 1 (France) | 1,739 | 4.07 | 24.3 |
| Allsvenskan (Sweden) | 1,391 | 3.72 | 25.0 |
| Eliteserien (Norway) | 1,376 | 3.38 | 21.5 |
| 1. Division (Norway) | 1,414 | 3.20 | 20.1 |
A selection of our 23 leagues. Every one of them is in the figures above.
Two and a half cards a match separate the top of this table from the bottom. Within one league, the lasting gap between a strict and a lenient referee is about 0.8. Fouls don't explain the difference between leagues either: Allsvenskan matches have more fouls than Premier League ones and fewer cards. Each league has its own idea of what deserves a booking, and its referees follow it.
Premier League referees since 2021/22
All 18 referees with at least 40 Premier League matches since 2021/22 who refereed in the league last season or this one. The league average is 4.26 cards a match, and 56.5% of matches went over 2.5 goals.
| Referee | Matches | Cards per match | Against the season average | Over 2.5 |
|---|---|---|---|---|
| Tony Harrington | 51 | 3.90 | −0.48 | 49% |
| Michael Oliver | 142 | 3.79 | −0.46 | 54% |
| Samuel Barrott | 66 | 4.08 | −0.36 | 68% |
| Andy Madley | 109 | 4.05 | −0.22 | 61% |
| Michael Salisbury | 63 | 4.13 | −0.19 | 65% |
| Jarred Gillett | 91 | 4.13 | −0.19 | 58% |
| Tim Robinson | 48 | 4.40 | −0.11 | 48% |
| Paul Tierney | 97 | 4.06 | −0.10 | 57% |
| Craig Pawson | 113 | 4.18 | −0.06 | 54% |
| Thomas Bramall | 56 | 4.31 | 0.00 | 48% |
| Simon Hooper | 108 | 4.35 | +0.05 | 56% |
| Anthony Taylor | 147 | 4.36 | +0.11 | 61% |
| Robert Jones | 101 | 4.44 | +0.14 | 61% |
| Darren England | 90 | 4.46 | +0.20 | 53% |
| Chris Kavanagh | 110 | 4.51 | +0.23 | 51% |
| Peter Bankes | 92 | 4.48 | +0.23 | 55% |
| Stuart Attwell | 110 | 4.50 | +0.27 | 58% |
| John Brooks | 80 | 4.84 | +0.50 | 51% |
Michael Oliver has refereed more Premier League matches than almost anyone in this period, and books fewer players than almost anyone: 3.79 cards a match over 142 games, close to half a card below average. Over that many matches, it is hard to put down to luck. John Brooks sits at the other end, half a card above.
Now look at the last column. Samuel Barrott's matches went over 2.5 goals 68% of the time, against 56.5% for the league. Does that make Barrott an overs referee? Our test says no. Across the 428 referees with long records, gaps like this did not carry into later matches, and in a table of 18 referees, chance alone would probably give one of them a gap this size over 66 games.
What it means for betting
Cards markets: the referee is a big input. Use a long record, at least 40 matches, and compare the referee with their own league, not with referees elsewhere. Then expect about half of the difference to hold. A referee who has averaged 0.8 cards above their league is a fair bet to be around 0.4 above it next time, not 0.8.
Goals markets: leave the referee out. Even the largest real effect we found on over 2.5, about 2 points either way, is smaller than the margin a bookmaker builds into the price. Backing overs because a referee "has high-scoring games" is backing a streak that, in our data, did not continue.
Penalties and red cards: be careful. Penalties did not repeat at all and red cards only weakly, and both are rare, so a referee's record of them is mostly noise. Penalty data is also incomplete in some leagues.
Know when the news arrives. Referees are usually appointed a few days before a match. A cards line set before the appointment is announced cannot include it, while a line set after it should. If you bet on cards, it is worth knowing which of the two you are looking at.
How we use it. Our model prices goals markets, both teams to score and over 2.5, and it does not use the referee. This study is the reason: for those markets, the referee adds almost nothing. We now store every appointment, so we can keep testing it as the seasons go on. If you want to go deeper into prices, our guide to what a value bet is is the place to start, and weather in football betting puts another popular factor through the same kind of test.
Frequently asked questions
Do referees affect the outcome of football matches?
Mostly through cards and fouls, not the result. In 42,172 matches across 23 leagues, a referee's record for cards and fouls carried over from their earlier matches to their later ones. Their record for goals, both teams to score and home wins did not: those differences were almost entirely chance.
Which Premier League referee gives the most cards?
Of the 18 referees with at least 40 Premier League matches since 2021/22 who refereed in the league last season or this one, John Brooks: 4.84 cards a match, half a card above the season average. Michael Oliver (3.79) and Tony Harrington (3.90) give the fewest.
How many cards does a referee give per game?
About 4.4 cards a match across our 23 leagues, yellow and red together. The league matters most: from 3.2 in Norway's 1. Division to 5.7 in Portugal's Liga Portugal. Within one league, the lasting gap between a strict and a lenient referee is about 0.8 cards.
Should I bet overs when a referee's matches are high-scoring?
No. Referees whose earlier matches went over 2.5 goals far more often than usual were back to normal in their later matches. A high-scoring run is mostly chance, and the largest real referee effect we found on over 2.5, about 2 points, is smaller than a bookmaker's margin.
When are referees appointed?
Usually a few days before the match, when the league publishes its appointments for the round. For cards betting that makes the appointment news: a line set before it cannot include the referee, while a line set after it should.
Betting involves risk. A referee is one input among many, and no record guarantees what happens in the next match. Only stake what you can afford to lose. 18+.