
Beyond xG: why xG betting no longer beats the odds
What xG means in betting, why bookmakers already price expected goals in, and which variables beyond xG still separate a model from the market.
Ten years ago, expected goals was an edge. A bettor who knew that a team had been creating far more chances than its results showed could find prices the market had set from the league table and recent scores.
That bettor no longer has the field to themselves. Expected goals has been on BBC Match of the Day since 2017, it sits in free score apps, and every serious bookmaker builds it into its prices. A statistic that everyone can see for free is, almost by definition, already in the odds.
This article explains what xG means in betting, why raw xG no longer beats the market on its own, and which variables beyond expected goals still separate a model from the price.
The short version
- xG measures chance quality, not luck. It is a better guide to a team's strength than goals alone — and that is exactly why the market already uses it.
- Raw xG is priced in. Betting "the team with the better xG" is what the bookmaker's own model does before the market opens.
- The edge has moved to the next layer: how chances are created, how form changes, schedule, league context and how volatile a team's matches are — combined, and compared against a margin-free price.
- Some popular "situational" factors are weaker than they sound. Momentum barely exists in the data, and weather and team news are public and priced within minutes.
What xG means in betting
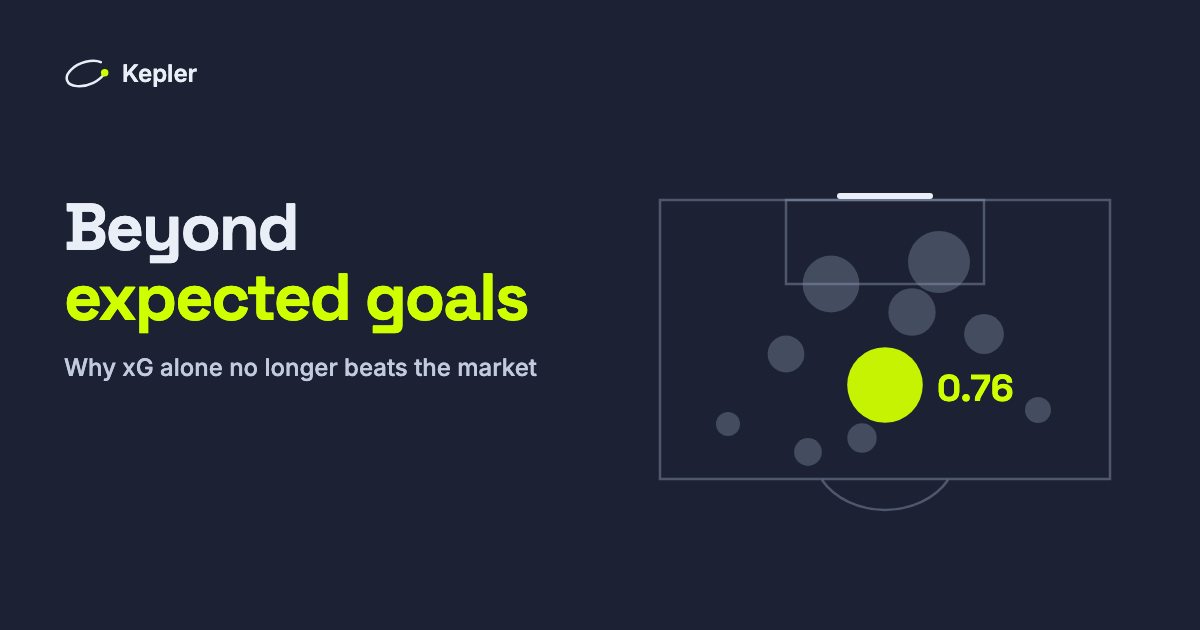
Expected goals assigns every shot a probability of being scored, based on thousands of similar shots: distance, angle, the part of the body used, the kind of pass that set it up. A penalty is worth around three-quarters of a goal (about 0.76–0.79 xG, depending on the data provider); a header from the edge of the box is worth a few hundredths.
Add a team's shots up and you get its xG for the match. Over a season, xG says more about how good a team is than its goals do, because goals are few and finishing swings wildly from one month to the next. A team scoring far fewer goals than its xG suggests is usually unlucky, not bad, and tends to recover.
For a bettor that was the original insight: the market priced results; xG priced performance. The gap between the two was money.
How xG went from secret to baseline
The idea is older than the name, but the modern version is usually traced to Opta analyst Sam Green, who in April 2012 published a model assessing Premier League shots by their chance of going in. For the next few years xG lived in analytics blogs and club analysis departments.
Then it went mainstream. Match of the Day first showed xG in its post-match graphics on 12 August 2017, and the BBC began explaining the metric to a national audience. Free apps followed, and today a casual fan can check a match's xG within minutes of the final whistle.
Once information is free and universal, it stops being an edge. Bookmakers were never behind the analytics community here; their trading models used chance-quality data before most bettors had heard the term. By 2026, xG is the starting point of a price, not a hidden ingredient.
How bookmakers set odds for football
A modern football price comes from three layers:
- A model. Team ratings built from historical event data — shots, xG, results — produce a fair probability for each outcome.
- A margin. The bookmaker adds its overround, so the implied probabilities add up to more than 100%. (To see how to remove it, read de-vigging explained.)
- The market. As professional bettors place money, the sharpest books move their prices toward where the money says the truth is. By kick-off, the closing price has absorbed nearly everything that is publicly known.
That third layer is why a simple xG system struggles. When you back the team with the better xG, you are competing with the bookmaker's model, which has the same data, and with every professional who has already moved the line.
Why raw xG no longer beats the market
There are four reasons a plain "back the better xG" approach rarely survives contact with a sharp price:
- It is public. Anything visible in a free app has been seen by the people setting and moving the line.
- It is already regressed. Bookmakers know that over- and under-performance against xG tends to fade. The "unlucky team due a win" is often already priced as exactly that.
- It describes shots, not situations. A team that leads early and sits back concedes more xG than its quality suggests. Raw xG cannot tell a defensive collapse from a deliberate game plan.
- It ignores what never became a shot. Pressure, territory and set-piece volume all create danger that only partly shows up in xG.
xG is still essential. It is just no longer sufficient.
Beyond xG: the variables that still separate a model from the market
The edge in 2026 lies in combining variables the market weighs imperfectly, and measuring them consistently across leagues. These are the ones that matter in our own modelling.
How chances are created, not just how many
Two teams with the same xG can get there very differently: one through a few clear chances inside the box, another through a stream of long-range attempts. Shots on target, shots from inside the box and the share of a team's attacks that become dangerous all add information that a single xG number flattens.
Territory and set-piece volume
Set pieces have become a larger part of the game. In the opening months of the 2025-26 Premier League season, set pieces produced around 28–30% of goals, close to the competition's record share. Corners and sustained territorial pressure are inputs to that, and they are not always obvious from a team's xG alone.
Form that weights the recent past
Form matters, but not as a streak. A model should let last week's match count for more than one from two months ago, and fade older results smoothly rather than cutting them off at five games. Home and away form should be measured separately, because some teams are very different travellers.
Schedule and rest
Days between matches change how teams rotate and how hard they press. Rest is a simple, measurable variable, and one that is easy to ignore when looking at a league table.
League context and volatility
Scoring rates differ between leagues and seasons, and some teams play consistently chaotic matches while others grind out 1–0s. A model that knows the scoring environment, and how volatile each team is, prices goal markets — Over/Under and Both Teams to Score — far better than one that treats every match alike.
What is overrated: momentum, weather and team news
Not every situational factor deserves its reputation.
- Momentum. A peer-reviewed study of the English Premier League, The hot hand fallacy re-examined, found no evidence that losing streaks predict further losses, and if anything a slight reversal after winning streaks. Its authors concluded momentum is better described as a label applied after the fact than as a cause. Recency-weighted form captures the real part of it.
- Weather. Heat, rain and wind do change how footballers perform physically, and research has looked at weather in match prediction — for example a 2020 study of Spanish football whose best models still used bookmaker odds among their main inputs. The forecast is public, and the market reads it too.
- Team news. Confirmed line-ups move prices, but they arrive about an hour before kick-off and are priced within minutes. Unless you are faster than the market, team news is not an edge; it is the market catching up.
How Kepler uses the layer beyond xG
Kepler starts from a statistical baseline that estimates the full distribution of scores for each match. A machine-learning layer then refines it using the variables above — chance creation, territory and corners, recency-weighted and venue-specific form, rest, league context and volatility — and produces one calibrated probability per market.
That probability is then compared with the bookmaker's price after the margin is removed. A signal is published only when the gap is large enough to matter, and every published pick goes on the public track record — wins, losses and closing line value alike. CLV is the honest test of whether a model is finding something the market has not: a pick that consistently beats the closing price was right before the market agreed.
How to use xG in your own betting
- Treat xG as the starting point, not the edge. If your reasoning is "this team's xG is better than its results", assume the price already knows.
- Look for disagreement with the price, not with the table. An edge is a probability higher than the margin-free implied probability, not a team you rate.
- Measure yourself on closing line value. It tells you whether your method beats the market long before profit does.
- Bet singles and stake flat. A real edge is small; accumulators and oversized stakes waste it. See singles vs accumulators and bankroll management.
Frequently asked questions
What does xG mean in betting?
Expected goals: the probability that each shot becomes a goal, added up for a team. Bettors use it to judge how well a team is really playing, beyond its results.
Is xG useful for betting?
Yes, as a starting point. Bookmakers already price raw xG, so on its own it rarely gives an edge; it becomes useful combined with other variables and compared with a margin-free price.
Do bookmakers use xG?
Yes. Their pricing models are built from the same match data, including shot quality, and the market moves prices further as professional money arrives.
Betting involves risk. Past results do not guarantee future returns. Only bet what you can afford to lose. 18+.