
11 losing days, 10 winning days, +15.95 units
September had more losing days than winning ones and still finished in profit. Why the size of wins and losses matters more than how often you're right.
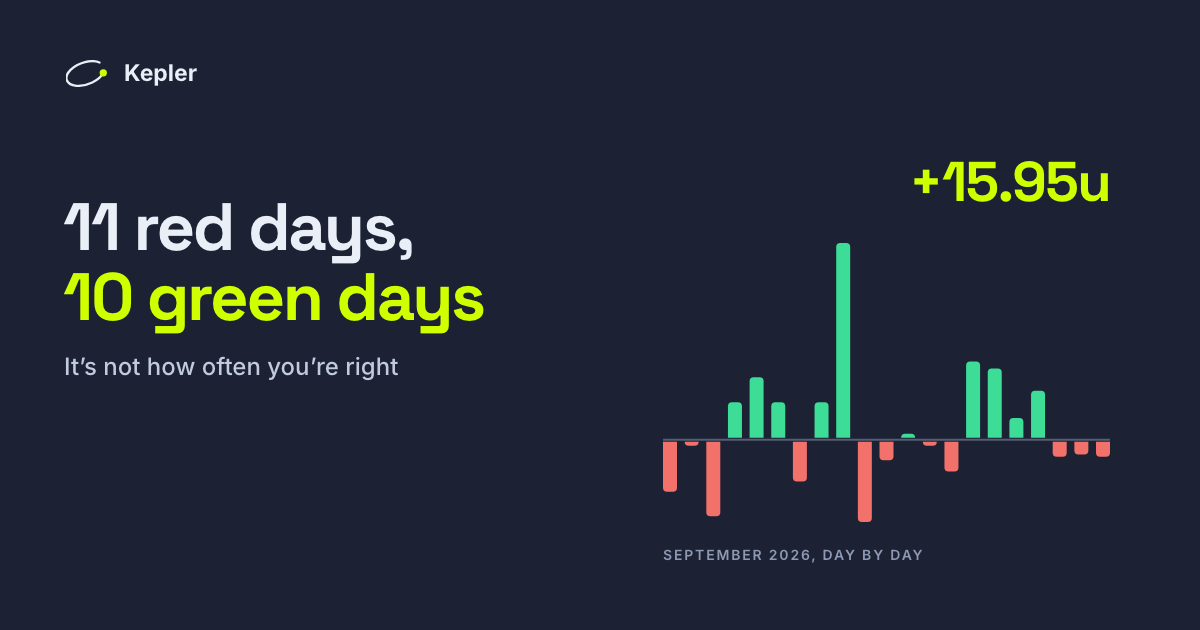
In September, picks settled on 21 days. Eleven of those days ended in a loss and ten in a profit. Count the days and it was a losing month. It finished +15.95 units.
October, halfway through, tells the same story from the other side: five green days, four red, and +15.13 units so far.
Neither result is a contradiction, and neither is about being right more often. Stanley Druckenmiller, who managed money for George Soros for more than a decade, put it better than we can. Of everything he learned from Soros, he called this the most significant: "it's not whether you're right or wrong." What counts is how much you make when you're right and how much you lose when you're wrong.
This article looks at what that means for betting, using our own two months as the example, including the parts that flatter us less.
The short version
- Counting winning days tells you very little. What matters is the size of the wins against the size of the losses.
- Our green days were bigger than our red days. In September the average green day made +3.87 units and the average red day cost 2.06.
- On a single pick it is the other way round. At average odds of 1.78, a winning pick pays 0.78 units and a losing pick costs 1. The edge comes from the price, not from winning big.
- The losing side is the part you control: flat stakes, single bets, no chasing.
- One day made most of September. That is normal with a small edge, and it is why we judge over hundreds of picks, not days.
Two months, day by day
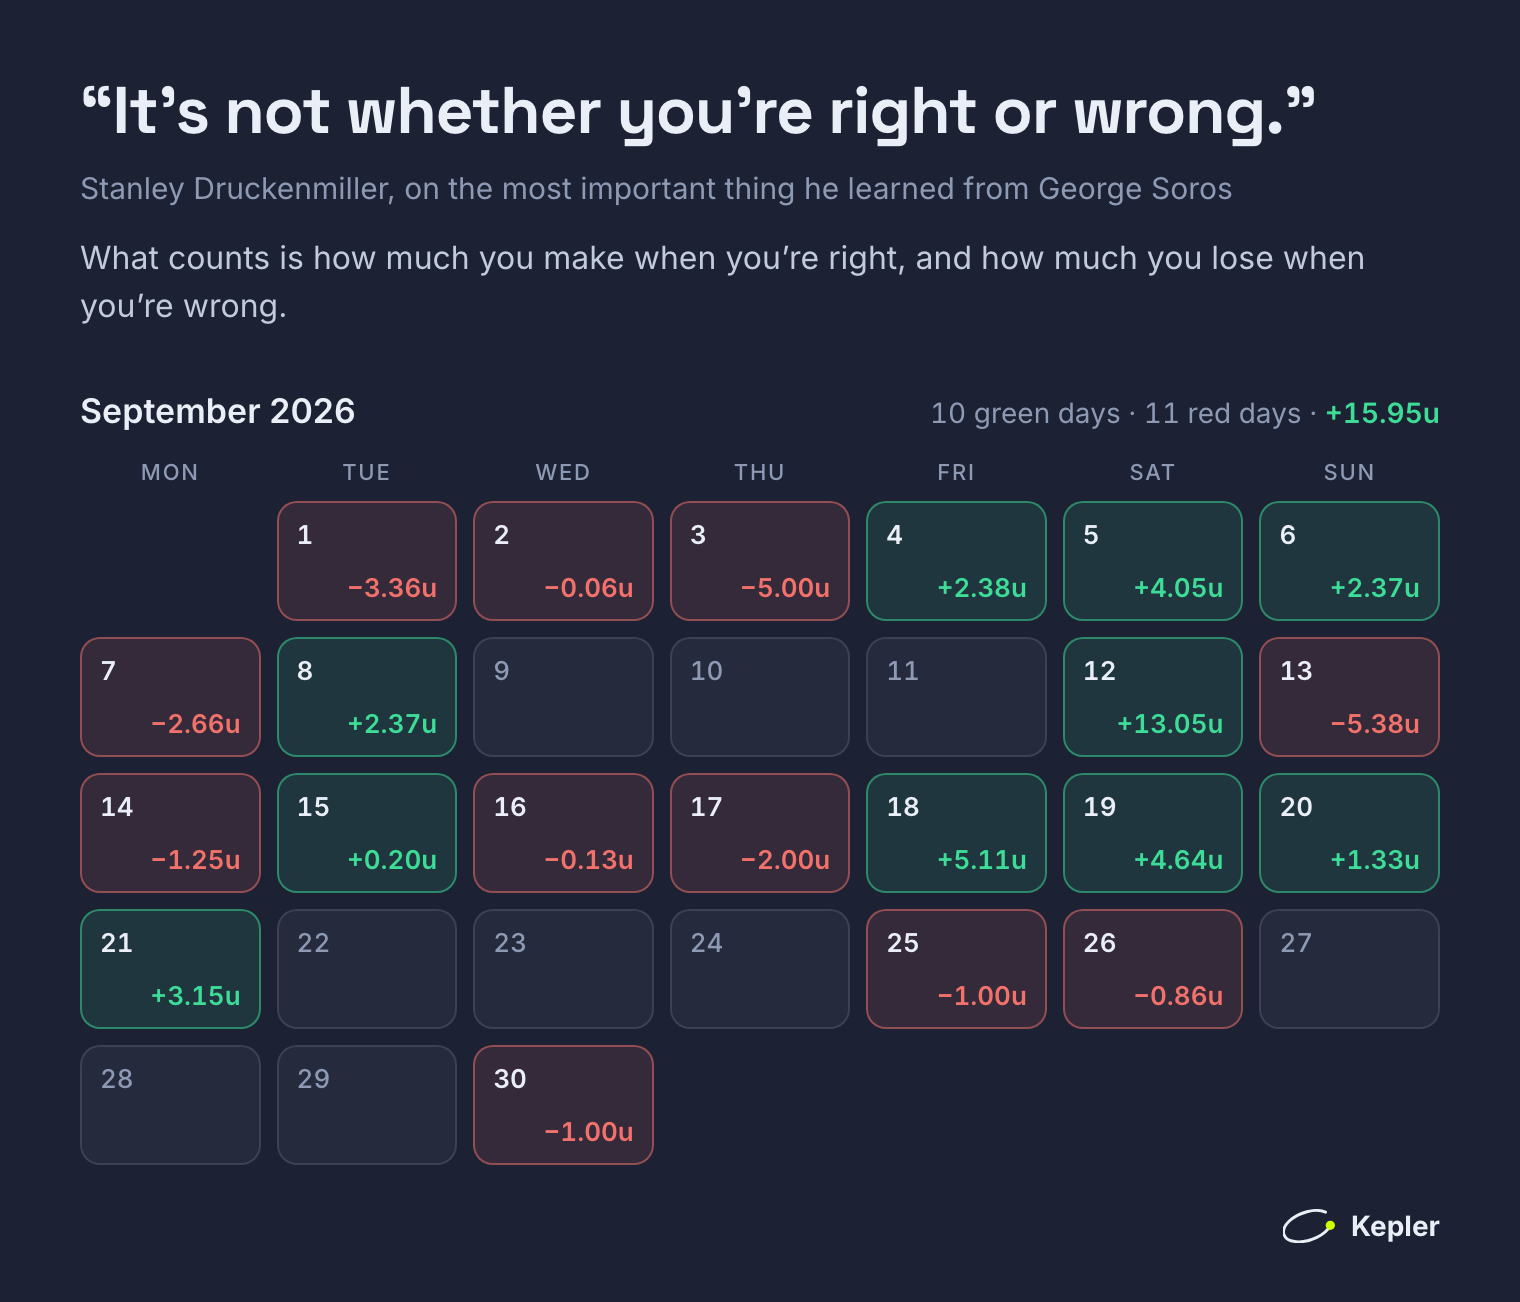
| Green days | Red days | Won on green days | Lost on red days | Month | |
|---|---|---|---|---|---|
| September | 10 | 11 | +38.65u | −22.70u | +15.95u |
| October (1–15) | 5 | 4 | +22.27u | −7.14u | +15.13u |
Per day, that is:
| Average green day | Average red day | |
|---|---|---|
| September | +3.87u | −2.06u |
| October (1–15) | +4.45u | −1.79u |
In September a typical green day was worth almost two red ones. That is the whole reason a month with more losing days than winning days ended in profit.
These figures come from our published record as it stood on 16 October 2026, one unit on every pick. The live figures are on the track record and move as picks settle.
Why counting days misleads
A day is not a unit of anything. A Saturday with a full fixture list and a quiet Tuesday with one match count the same in a tally of green and red days. So do a day that made +0.20 units (15 September) and a day that made +13.05 (12 September).
The same goes for counting winning picks. A pick at 1.30 that wins 70% of the time loses money; a pick at 2.20 that wins 50% of the time makes it. A win rate on its own, like a count of green days, says nothing until you know what each win paid and each loss cost.
On a single pick, a win is smaller than a loss
Here is the part the quote hides. On the day level our wins were bigger than our losses. On a single pick they are not.
At September's average odds of 1.78, a winning pick returns 0.78 units on a one-unit stake, and a losing pick costs the full unit. To break even at those odds you need to win 1 ÷ 1.78 = 56.2% of the time. In September the picks won 58.1%.
That gap of about two points is the entire edge. It works out at roughly 3% per pick in theory, close to the 2.8% the month actually returned.
Which means "how much you make when you're right" is decided before the match, by the price you take. Take the same picks at 1.70 instead of 1.78 and the break-even rises to 58.8%: with the same 58.1% win rate, September would have lost money. This is why we measure every pick against the closing price, and why the price matters more than the prediction. We go into it in what is a value bet and why CLV is the only metric that matters.
The part you control: how much you lose when you're wrong
You cannot choose which picks win. You can choose what a loss costs.
- Flat stakes. Every losing pick costs exactly one unit, never more. The worst case of a red day is known before the first match kicks off.
- Single bets. One loss costs one stake. In an accumulator, one loss sinks the whole ticket, including every pick that won. See singles vs accumulators.
- No chasing. Raising stakes after a red day makes the next red day bigger, and the next red day will come. In September it came eleven times.
- The same stake on green days and red days. A system that is only slightly ahead stays ahead because nothing about the stake changes with your mood. More in our bankroll management guide.
The honest part: one day made most of September
12 September made +13.05 units on its own: more than four fifths of the month's profit. Without it, September would have finished +2.90 units. In October, take away the best day (11 October, +8.96) and the half-month stands at +6.17.
That is what results with a small edge look like. Most days land close to zero, and a few big days, in either direction, decide the month. The day after September's best day was its worst: −5.38 units on 13 September.
It also means a single month is a small sample. October's return of +14% over its first two weeks is far above what a small edge produces over time, and we expect it to come down. A month can just as easily end red, even when the picks are good. That is why we judge the model over hundreds of picks, and use closing line value as the earlier check: it shows whether the prices were good long before the results can.
What to take from it
- Stop counting green days. Look at the month, then the quarter.
- Know your break-even. It is 1 ÷ the odds: 55.6% at 1.80, 50% at 2.00. A win rate above it at the price you take is an edge; below it is not.
- Take the best price you can. Every signal shows a "Bet at ≥" price, the lowest that still has value. Below it, skip the pick.
- Keep stakes flat and bet singles. That is how a red day stays small.
- Expect red days. In September they were the majority. Do not let one change your stake.
Frequently asked questions
Is a high win rate a good sign?
Only next to the odds. A 60% win rate at odds of 1.50 loses 10%, because the break-even there is 66.7%. A 45% win rate at 2.40 makes 8%, because the break-even is 41.7%.
Why can a month with more losing days end in profit?
Because the days are not the same size. In September 2026 our average green day made +3.87 units and our average red day cost 2.06, so ten green days outweighed eleven red ones.
How many picks before results mean something?
Hundreds. Over 500 picks with a 3% edge at odds near 1.80 you would expect about +15 units, but luck alone can move that by around 20 units either way. Closing line value shows whether the prices are good much sooner.
Should I stake more after a losing day?
No. A red day does not make the next day more likely to be green. Raising the stake only makes the next red day bigger. Keep one unit on every pick.
Betting involves risk. Past results do not guarantee future returns, and a profitable month says little about the next one. Only stake what you can afford to lose. 18+.