
Sports betting benchmarks: measuring real edge
Betting moved from private bookmaker accounts to public sharp prices. How to benchmark a betting model the way the market actually trades.
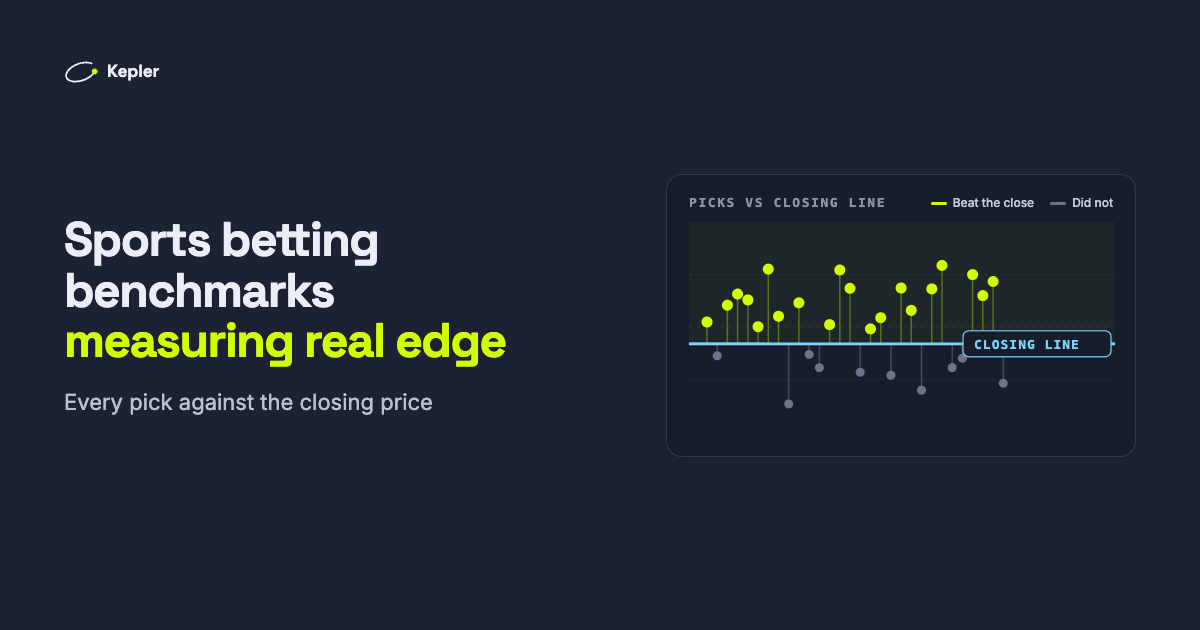
Ten years ago, finding value in football betting mostly meant having the right bookmaker accounts. Prices were set behind closed doors, every book built its own margin in, and the bettor who won too often was quietly limited. Today the reference prices are public. Sharp bookmakers and betting exchanges publish prices anyone can see, compare and measure against.
That change in how the market is built has a consequence most bettors have not caught up with: the way we measure betting performance has to change with it. A win rate and a profit figure describe what happened. They do not describe what was actually available to bet, at what price, and whether the price was any good. This article sets out how to benchmark a betting model the way the market really trades.
Key takeaways
- The market moved from private to public prices. Sharp books and exchanges now set reference prices in the open, which makes every pick measurable against them.
- Measure the bet you could actually place. The same prediction can win or lose money depending on the price taken, when it was taken and how the bookmaker's margin is treated.
- A betting benchmark needs fixed rules. Every pick, one flat unit, the price captured when the pick was issued, compared with a margin-free closing price. Nothing removed afterwards.
- Closing line value adds to ROI, it does not replace it. Profit is the outcome; beating the closing price is the evidence that the process has an edge.
From private accounts to public prices
For most of the history of betting, the price was a private matter between you and your bookmaker. Each book set its own odds, often built a margin of 5% or more into them, and adjusted to its own customers. There was no single price to measure against, so there was no fair way to compare one bettor's record with another's.
Two things changed that. Sharp bookmakers such as Pinnacle chose to take large bets on thin margins and let the money move the price, so their odds became the market's best estimate of each match. And betting exchanges let bettors trade against each other, so prices are set by supply and demand rather than by a single book's risk desk. We compare the two kinds of bookmaker in sharp vs soft bookmakers.
The result is a market with a public reference price, like any other liquid market. That is good news for anyone who wants to know whether a model works, because it gives every pick something objective to be measured against.
Measure the bet you could actually place
A prediction is not a bet. "Both teams will score" says nothing about whether it was worth backing until you know the price. The same opinion taken at 1.95 can be a good bet, and at 1.70 a bad one.
So the result of a betting strategy depends on its implementation, not only on its predictions:
| Implementation detail | Why it changes the result |
|---|---|
| Which price was taken | A few points of odds decide whether a pick has an edge at all |
| When it was taken | Prices move as information arrives; an early price can be better or worse than the close |
| How the margin is treated | Odds include the bookmaker's cut; without removing it, every comparison is biased |
| What it is compared with | A soft book's price is a weak benchmark; a sharp closing price is the strongest one available |
| Which picks are counted | A record that drops losers, or shows only "best bets", measures nothing |
This is why a win rate on its own says so little. A pick at 1.30 that wins 70% of the time loses money; a pick at 2.20 that wins 50% of the time makes it. The prediction and the price have to be measured together.
What a rules-based betting benchmark looks like
In finance, an index is useful because its rules are fixed and published: anyone can check how it is built and what it would have returned. A betting record should work the same way. Four rules turn a list of picks into a benchmark:
- Every pick counts. Each published pick is recorded and kept, whether it wins or loses. Nothing is removed or edited later.
- One flat unit per pick. Staking is held constant, so the record measures the picks rather than someone's staking decisions.
- The price captured when the pick was issued. Not the best price seen afterwards, and not a price nobody could get.
- Compared with a margin-free closing price. The closing price of a sharp bookmaker is the market's final, most informed estimate. Removing its margin first makes the comparison like for like. We explain the arithmetic in de-vigging explained.
The fourth rule produces closing line value (CLV): how much better, or worse, each pick's price was than the market's final estimate. It is the most useful single number in betting, for reasons set out in why CLV is the only metric that matters: it can be measured on every pick as soon as the match kicks off, long before enough results come in to separate skill from luck.
These are the rules Kepler's public track record is built on. Every published pick is listed with the price captured when it was issued, its closing price where we hold it and its result, and a published pick is never removed, even when the model later changes its view.
From benchmarks to building blocks
Once a record is measured consistently, it can be broken down. Each market and each league becomes a building block with its own record: both teams to score in the Championship, over 2.5 goals in Serie A, and so on. Every league page on Kepler carries its own track record for exactly this reason; you can see them all from the leagues we cover.
Seen as building blocks, a betting portfolio starts to look like any other portfolio:
- Some blocks carry more edge than others. In September 2026, both teams to score beat the closing price 65.9% of the time and returned +5.7%, while over/under 2.5 beat it 53.8% of the time and finished slightly down.
- Combining blocks changes the variance, not the edge. Picks spread across many leagues and two markets swing less, in total, than the same number of picks in one league.
- Every block needs its own sample. One league's 30 picks are not enough to judge that league on its own, which is why our league pages say so when the sample is small.
You do not have to follow every block, either. Some subscribers follow one market, some only the leagues they know, and the record lets each of them see how their own selection has done.
An addition, not a replacement
None of this makes return on investment unimportant. Profit is what you take home, and win rate tells you how often you should expect to be right. Closing line value sits beside them and answers a different question.
| Measure | What it tells you | Its weakness |
|---|---|---|
| Win rate | How often the picks win | Ignores the price |
| ROI / yield | What the picks returned | Needs a very large sample to tell from luck |
| Closing line value | Whether the prices taken were better than the market's final estimate | Measures the process, not the money |
Read together, they tell you more than any of them alone. A strategy with positive CLV and a losing month is probably unlucky. A strategy with a winning month and negative CLV is probably lucky, and the luck will run out.
What this looks like in practice
Kepler's September 2026 report applies these rules to a full month: 573 published picks, all settled, a return of +2.4%, an average closing line value of +1.94%, and 57.8% of the picks with a sharp closing price taken at a better price than the close.
It also shows why the rules matter. In the second half of the month the picks we could measure against the close beat it nearly six times in ten, and still lost money between them. Judged on profit alone, that fortnight looked like failure. Judged on price, the process was working. A month is a small sample, and we say so in the report.
Measurement that matches the market
Betting markets have become more transparent, and that makes better measurement possible. Before you trust any model, tipster or betting tool, ask whether its record follows the same rules a benchmark would:
- Is every pick published, with the price it was issued at?
- Is staking flat, or can the record hide behind stake sizes?
- Is performance compared with a sharp, margin-free closing price?
- Is the sample size stated honestly, and are losing periods shown?
A record that passes all four is one you can evaluate. A record that cannot, whatever its win rate, is a marketing claim.
Frequently asked questions
How do you measure betting performance properly?
Record every pick at the price it was actually taken, stake one flat unit, and compare each price with a sharp bookmaker's closing price once its margin is removed. Read return on investment alongside closing line value, never win rate alone.
What is a benchmark in sports betting?
The closing price of a sharp bookmaker or exchange with its margin removed: the market's final, best-informed estimate of a match. A pick taken at a better price than that close has beaten the benchmark.
Is ROI or closing line value more important?
They answer different questions. ROI is what the picks returned, but it takes a very large sample to tell it from luck. Closing line value shows whether the prices taken were good, and it can be measured from the first match.
How many bets do you need to judge a betting model?
Closing line value starts to say something after a few hundred picks. Profit usually needs thousands, because the result of each match is mostly noise. A shorter record is a hint, not proof.
Betting involves risk. Past performance does not guarantee future results. Only stake what you can afford to lose. 18+.