
Kepler signals report: October 2026
October in numbers: how often the 331 picks on Kepler's record beat the closing price, how it varied by market, and what one month can show.
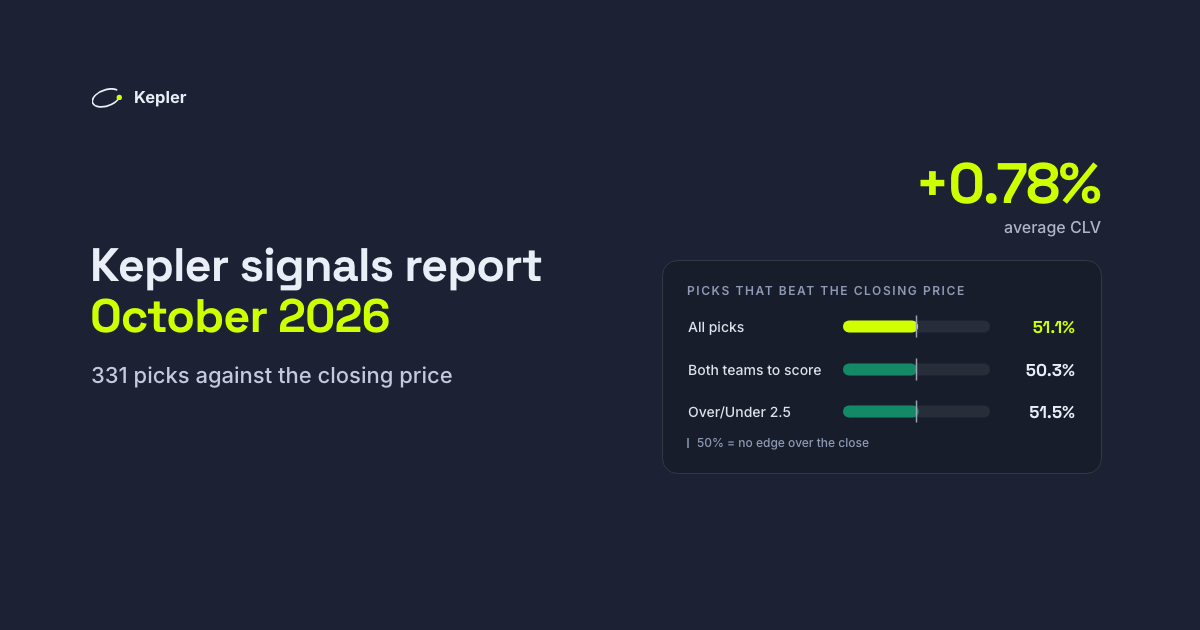
This report covers every pick on the public record for matches played in October 2026: 331 of them, all settled. It looks at the month the way a trading desk reviews its execution: not only at how many picks won, but at whether they were taken at a better price than the one the market finally settled on.
Every figure here comes from the public track record, where each pick is listed with its price, its result and, where we have it, its closing price.
What changed since September
The public record now shows today's published selection: both teams to score at 55-60% confidence, Over/Under 2.5 at 58% or more, and the cards calls with value. That rule took effect on 27 October. For 1-26 October the figures apply it to that period's predictions, so they are not what subscribers were sent at the time.
The September report counted a wider set of picks, so its figures can't be set directly beside these. Further down we restate September on today's selection.
Key takeaways
- The month finished flat: −2.65 units on 331 picks, a return of −0.8%. At the kick-off price the same picks made +0.24 units. Either figure is well within what chance alone can produce in a month.
- About half the picks beat the closing price. Of the 233 with a sharp closing price to compare against, 51.1% were taken at a better price than the market's final one, by more than half a point. The average closing line value (CLV) was +0.78%. A pick with no edge over the close would land near 50%, so this measure shows little.
- Both teams to score lost money: −13.16 units on 261 picks, a return of −5.0%, and it beat the close 50.3% of the time.
- Cards kept the month flat. The 37 cards calls made +9.27 units, but 21 of them are replayed, not live. Without cards, the goals markets lost 11.92 units.
- Picks that beat the close won more often: 62.2% against 50.0%. Part of that gap is expected, as we explain below.
Why we measure the closing price, not the win rate
A win rate on its own says little. A pick at 1.30 that wins 70% of the time loses money; a pick at 2.20 that wins 50% of the time makes it. And over a few hundred picks, the result of each match is mostly noise.
The closing price is the market's last and best estimate of a match, after all the information and all the money has come in. Taking a better price than that, again and again, is the most reliable sign that a model is seeing something the market only catches up with later. It shows up long before profit can be told apart from luck. We explain the idea in full in why CLV is the only metric that matters.
We compare each pick's price with a sharp closing price once its margin is removed, so the comparison is like for like. A pick counts as beating the close when its price is more than half a point better (CLV above +0.5%): a smaller move is the size of a price tick, not information.
How often the picks beat the close
| Market | Picks settled | Win rate | Return | Beat the close | Average CLV |
|---|---|---|---|---|---|
| Both teams to score | 261 | 55.6% | −5.0% | 50.3% | +0.44% |
| Over/Under 2.5 | 33 | 60.6% | +3.8% | 51.5% | +1.69% |
| Cards, pre-match | 16 | 68.8% | +21.9% | 71.4% | +5.95% |
| Cards, replayed | 21 | 71.4% | +27.5% | none | none |
| All picks | 331 | 57.7% | −0.8% | 51.1% | +0.78% |
At average odds of 1.73, a pick has to win 57.8% of the time to break even. October's picks won 57.7%, which is why the month finished flat.
Neither goals market beat the close by much. Over/Under 2.5's average of +1.69% leans on two picks from before 27 October that averaged +11.14%; the 31 picks since then averaged +1.08%, and 48.4% of them beat the close. The cards figures look strong, but 37 calls are too few to judge, and only 7 of them have a closing price.
Did the picks that beat the close win more?
If beating the closing price is a real sign of value, the picks that do it should, over time, win more often than the ones that do not.
They did: 62.2% against 50.0%, at slightly higher odds. In units the picks that beat the close made +8.32, while the others lost 17.27.
This needs reading with care. A price that shortens towards a pick usually means the market has learned something that makes the pick more likely to win, so part of this gap is expected from any set of picks. It shows that the closing price is a good judge. An edge would show in how often the picks beat the close, and in October that was only about half the time.
Process against outcome
The publishing rule took effect on 27 October, so the month splits there.
| Period | Picks | Win rate | Profit | Beat the close | Average CLV |
|---|---|---|---|---|---|
| 1-26 October | 238 | 57.6% | −2.06 units | 47.1% | +0.37% |
| 27-31 October | 93 | 58.1% | −0.58 units | 59.2% | +1.65% |
The two periods won at almost the same rate, and both finished close to flat. The price tells a different story: fewer than half the picks beat the close before 27 October, and nearly six in ten did after it. That second figure rests on 76 picks over five days, so it is a reason to keep watching, not a result.
Cards flatter both periods. The goals markets alone lost 7.83 units on 1-26 October and 4.09 units on 27-31 October.
October against September
Here are both months on today's selection, so they can be compared.
| Month | Picks | Win rate | Return | Beat the close | Average CLV |
|---|---|---|---|---|---|
| September | 212 | 62.3% | +8.4% | 67.6% | +3.23% |
| October | 331 | 57.7% | −0.8% | 51.1% | +0.78% |
On these terms October was the weaker month on every measure. Two things limit the comparison. September's figures rest on only 34 picks with a closing price, against 233 in October, because closing prices were first recorded on 13 September. And September is entirely the selection applied to past matches, all of it both teams to score.
What the model covered
October's 331 picks came from 20 leagues. The most covered were Serie A (59 picks), Serie B (47), League Two (35), the Championship (33), La Liga 2 and League One (21 each) and the Premier League (20): top flights alongside the lower divisions, where prices are often set with less attention.
You do not have to follow every pick
A trading desk does not automate every order, and you do not have to follow every signal. Kepler can be used in different ways:
- As a shortlist. Each signal is a match where the model's price and the market's disagree. Treat it as a starting point and check it against your own view before staking anything.
- By market. Follow only the markets where the edge has been clearest, judged by closing line value rather than by last week's results.
- In full. Follow every signal at a flat stake, the easiest approach to measure.
Whichever you choose, judge it over hundreds of picks, not a few days, and judge it by the price you got against the close.
How we measured this, and its limits
- Period: every pick on the public record for a match played from 1 to 31 October 2026: 331 picks on 25 days, all settled.
- Selection: both teams to score at 55-60% confidence, Over/Under 2.5 at 58% or more, and the cards calls with value. The rule took effect on 27 October; before that date the figures apply it to that period's predictions. The over/under model behind these picks started on 26 October, so 31 of its 33 picks are from the last five days.
- Cards: 37 calls. The 16 pre-match calls were made before kick-off on 27-31 October. The 21 replayed calls are the current cards model run later on earlier matches, so they were not available at the time.
- Stakes: one flat unit per pick, at the price when published. Profit is in units.
- Closing line value: the pick's price against a sharp closing price with its margin removed, from a sharp bookmaker or an exchange. One is available for 233 of the 331 picks: 226 goals picks and 7 cards calls. Every figure about the close uses those 233 only, and a pick beats the close when its CLV is above +0.5%.
- Sample size: the month's return of −0.8% has a standard error of 4.7 points, which gives a 95% range of roughly −10% to +8%. A month of picks is not enough to separate skill from luck on profit alone.
Every pick, winners and losers, is in the public track record. We will publish this report again each month, so the numbers can be compared.
Frequently asked questions
What does beating the closing price mean?
A pick beats the close when the price it was taken at is better than the sharp market's final price before kickoff by more than half a point (CLV above +0.5%), once that price's margin is removed. Doing it consistently is the most reliable early sign that a model finds value.
Why report closing line value and not just profit?
Over a month, profit is mostly the result of a few hundred coin-like outcomes, and luck can swing it either way. Closing line value measures the price, which shows whether the picks were good long before the profit can.
Why do only 233 of the 331 picks have a closing price?
Closing line value needs a like-for-like closing price from the sharp market. None was captured for 68 goals picks, and closing prices for cards only began on 29 October, so 30 cards calls have none. Every figure about the close in this report uses the 233 picks that have one.
Why don't these figures match the September report?
The September report counted a wider set of picks. The public record now shows today's published selection, and this report follows it, so it restates September on the same basis: 212 picks and a return of +8.4%.
Are these the picks subscribers received in October?
Not before 27 October. The publishing rule took effect that day, and for 1-26 October the figures apply it to that period's predictions. Subscribers received a different set at the time.
How often is this report published?
Monthly, so each month's figures can be compared with the last. Every pick behind them is listed in the public track record.
Betting involves risk. Past performance does not guarantee future results. Only stake what you can afford to lose. 18+.