
Expected threat (xT) in football: a betting guide
What expected threat (xT) is, how it values passes and carries before a shot, how it differs from xG, and what it can and cannot tell a bettor.
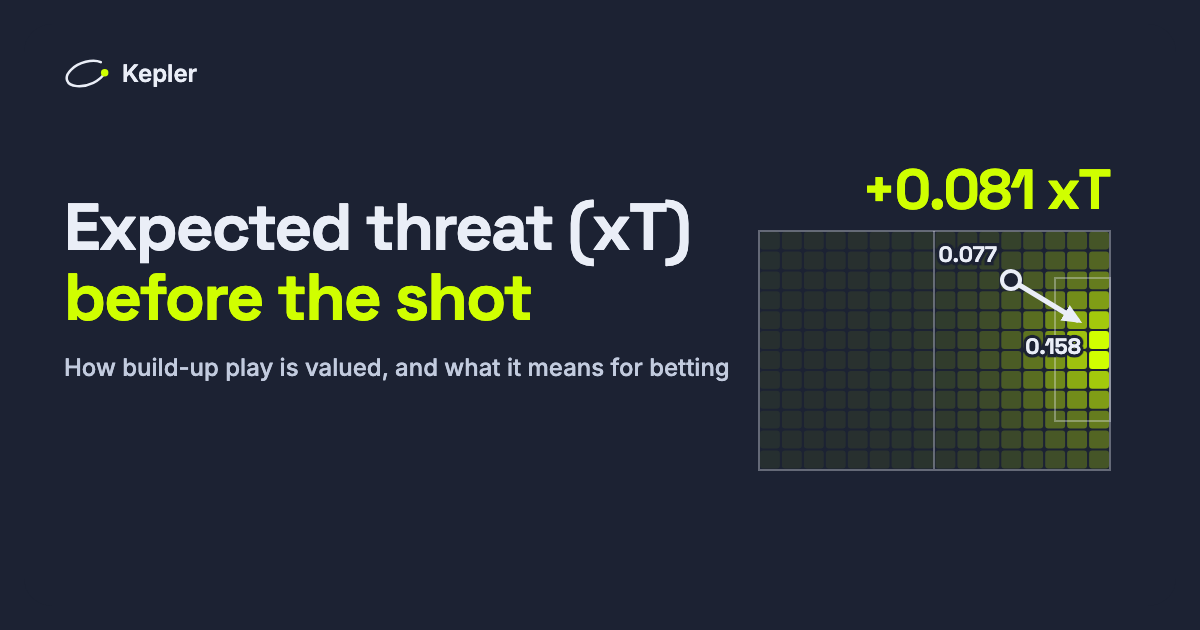
Expected goals only starts counting when somebody shoots. Everything that happens before, the pass that breaks a line or the carry into the box, earns nothing until the ball is struck. Shots are a tiny part of a match: StatsBomb puts them at less than 1% of all on-ball actions.
Expected threat, or xT, measures the other 99%. It puts a value on every pass and carry by asking how much each one changed a team's chance of scoring. This article explains what expected threat is, how it is calculated, how it differs from xG, and what it can and cannot tell a bettor.
The short version
- xT values the build-up, not just the shot. Every zone on the pitch gets a value: the chance of scoring from there within the next few actions. A pass or carry is worth the difference between where it starts and where it ends.
- It is a leading indicator. A team can create a lot of threat before it creates many shots, so xT can show pressure building before xG or the scoreline does.
- It is not a secret edge. The event data behind xT is sold to clubs, media and bookmakers alike, and better models (VAEP, Possession Value, On-Ball Value) already go further than xT.
- Threat that never becomes shots is not always bad luck. Sometimes it is a team that cannot finish its moves. The honest use of xT is as one input among several, compared with a margin-free price.
What is expected threat (xT) in football?
Expected threat was introduced by analyst Karun Singh in a widely shared post built on a full season of Premier League event data (2017/18). The idea is simple enough to explain without equations.
Divide the pitch into a grid; Singh used 16 columns by 12 rows, which makes 192 zones. For each zone, look at what players did when they had the ball there:
- how often they shot, and how often those shots went in, which is a very simple xG;
- how often they moved the ball with a pass or a dribble instead, and where the ball went.
The value of a zone is the chance of scoring from it: either by shooting now, or by moving the ball to another zone and scoring from there. Because each zone's value depends on the others, the calculation is repeated until it settles, which in Singh's data took four or five rounds. The result is the probability of scoring within the next few actions from any spot on the pitch. Values are tiny near your own goal and climb steeply towards the opponent's.
Then the useful part: the value of an action is the change it causes. A pass from a zone worth 0.077 to a zone worth 0.158 adds 0.081 xT, whether or not anybody shoots afterwards.
A worked example: who really created the chance?
Singh's original example is an Arsenal goal against Burnley. Mesut Özil split the defence with a pass to Sead Kolašinac, whose cutback was finished by Pierre-Emerick Aubameyang.
On the scoresheet, Kolašinac gets the assist and Özil gets nothing. With xT the picture changes:
| Action | From | To | xT added |
|---|---|---|---|
| Özil's through ball | 0.077 | 0.158 | +0.081 |
| Kolašinac's cutback | 0.158 | 0.171 | +0.013 |
By this measure Özil was responsible for about 86% of the threat the move created and Kolašinac for 14%. The pass that changed the situation was the one before the assist, and xT is built to see it.
xT vs xG: what is the difference?
| Expected goals (xG) | Expected threat (xT) | |
|---|---|---|
| What it values | Shots | Passes and carries, before any shot |
| Question it answers | How likely was this shot to score? | How much more likely did this action make a goal? |
| Data needed | Shot data | Event data with pitch coordinates for every pass and carry |
| Where it is used | Everywhere, including TV and free apps | Clubs, analysts and data providers |
| Blind spot | Danger that never became a shot | Risk, defensive pressure and movement off the ball |
xG tells you how good a team's chances were. xT tells you how well it moved the ball towards good chances. Over a short run, a team can be good at the second and unlucky with the first.
Beyond xT: VAEP, Possession Value and On-Ball Value
xT is the simplest member of a family of models that value every on-ball action. Its simplicity is the attraction, and also the limit.
- VAEP (KU Leuven, 2019) values an action by how it changes the chances of scoring and of conceding, using the whole game state rather than the ball's location alone.
- Opta's Possession Value (2019/20) estimates the chance of a possession ending in a goal and charges players for losing the ball as well as crediting them for progress.
- StatsBomb's On-Ball Value (2021) also weighs scoring against conceding for each event.
What they share is the reason xT alone falls short. The basic version counts only completed actions, so a risky pass that is cut out costs nothing. It knows where the ball is, not where the defenders are. And, as StatsBomb notes, event data cannot see movement off the ball: the run that made the pass possible earns no credit of its own.
Can expected threat find betting value?
The case for xT in betting is easy to make. If a team keeps moving the ball into dangerous areas but scores little, its results may be lagging its performance, and prices built from results will lag with them. In theory, threat leads, shots follow and goals follow the shots.
The honest view needs three caveats.
1. Not all unconverted threat is bad luck. Some teams reach the edge of the box and repeatedly fail to create a clear shot. That is a real weakness, not variance, and it may not fade. Threat that does not turn into shots needs explaining before it is bet on.
2. The evidence for betting is thin. xT was designed to credit players in build-up play, not to forecast match results. We know of no public evidence that adding xT to a well-built goals model reliably beats closing prices. Any claim that it does deserves to be checked against a track record.
3. The data is not exclusive. Calculating xT needs event data with coordinates for every action. That data comes from commercial providers, and bookmakers buy it too. A metric that sharp bookmakers and syndicates can compute is unlikely to be a free edge on its own, for the same reason that raw xG is now in the price; see why xG no longer beats the odds.
What xT-style thinking does offer is a better question. Instead of "who won?" or even "who had the better chances?", ask "who controlled the dangerous parts of the pitch, and has the price noticed?"
How to use xT-style thinking in your own betting
- Compare three numbers, not one. Goals, xG and a measure of threat or territory. A team ahead on all three is simply good. A team ahead on threat and xG but behind on goals is the interesting case.
- Look at long runs, not single matches. One dominant game proves little. A gap that persists over many matches is worth more, and is less likely to be noise.
- Think about the market you are betting. Sustained pressure feeds shots and corners, so it matters most for goal markets such as Over/Under and Both Teams to Score.
- Price it, then compare. An opinion about a team is not an edge. Turn it into a probability and compare it with the margin-free price.
- Judge the method by closing line value. If your read on pressure is right, the market should move your way before kick-off. See why CLV matters.
How Kepler measures pressure before the shot
Kepler does not calculate xT. Our data is match-level rather than a record of every pass with its coordinates, and we would rather say so than borrow the name.
What Kepler's model does measure is the pressure that comes before goals: our own proxy expected-goals figure, shots on target, shots from inside the box, corners, possession and dangerous attacks. A machine-learning layer combines them with recency-weighted and venue-specific form, rest days, league context and how volatile each team's matches are, and produces one probability per market.
That probability is compared with the sharp market's price after the margin is removed, and a signal is published only when the gap is large enough to matter. Every published pick goes on the public track record, wins and losses alike, with its closing line value, so you can judge the method for yourself.
Frequently asked questions
What is expected threat (xT) in football?
A model that gives every zone of the pitch a value: the chance of scoring from there within the next few actions. A pass or carry is worth the difference between where it starts and where it ends, so build-up play gets credit before any shot.
What is the difference between xT and xG?
xG values shots: how likely each one was to score. xT values the passes and carries before them: how much each one raised the chance of a goal. xG measures chance quality; xT measures how well a team moves the ball towards chances.
Can you use xT for betting?
As one input among several. Sustained threat can show a team playing better than its results, but threat that never becomes shots is sometimes a real weakness, and the data behind xT is available to bookmakers too. Compare any view with a margin-free price and judge it by closing line value.
Where can I find xT data?
Calculating xT needs event data with pitch coordinates for every pass and carry, which comes from commercial data providers. Some analytics sites publish xT or similar possession-value figures; definitions differ between them, so compare like with like.
Betting involves risk. Past results do not guarantee future returns. Only bet what you can afford to lose. 18+.